When the Palestinian terrorist organisation Hamas launched its unprecedented attack on Israel in the early hours of 7 October 2023, it unleashed a war that has since caused enormous suffering.
To visualize the damage caused by the conflict in Gaza, I extracted building footprints from »OpenStreetMap« using its Overpass API. I then matched this data with AI-derived satellite footprint data from Microsoft’s GlobalMLBuildingFootprints dataset and added missing building footprints.

Analysis on a micro scale…
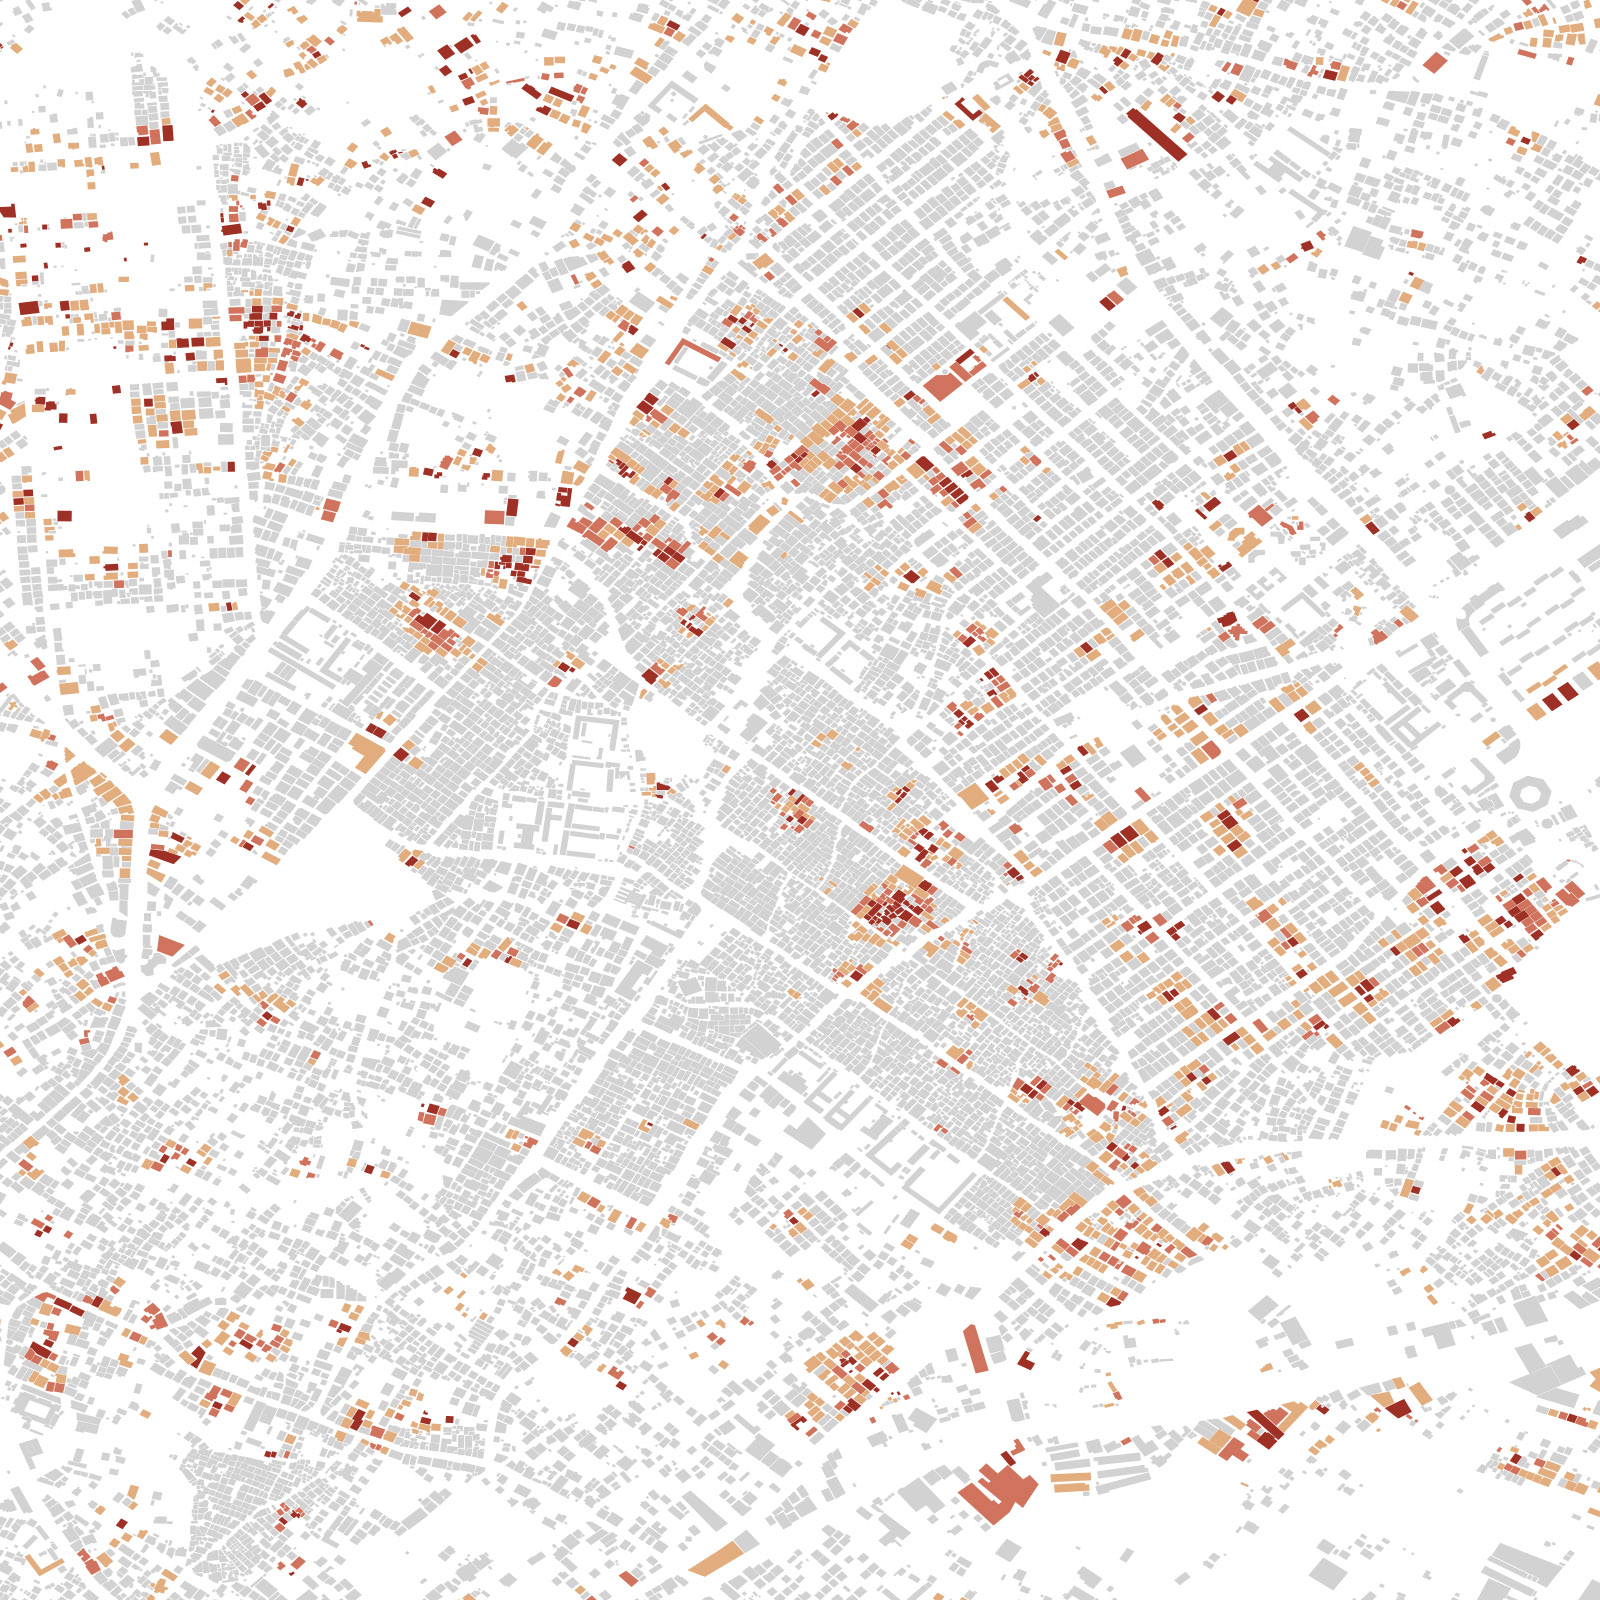
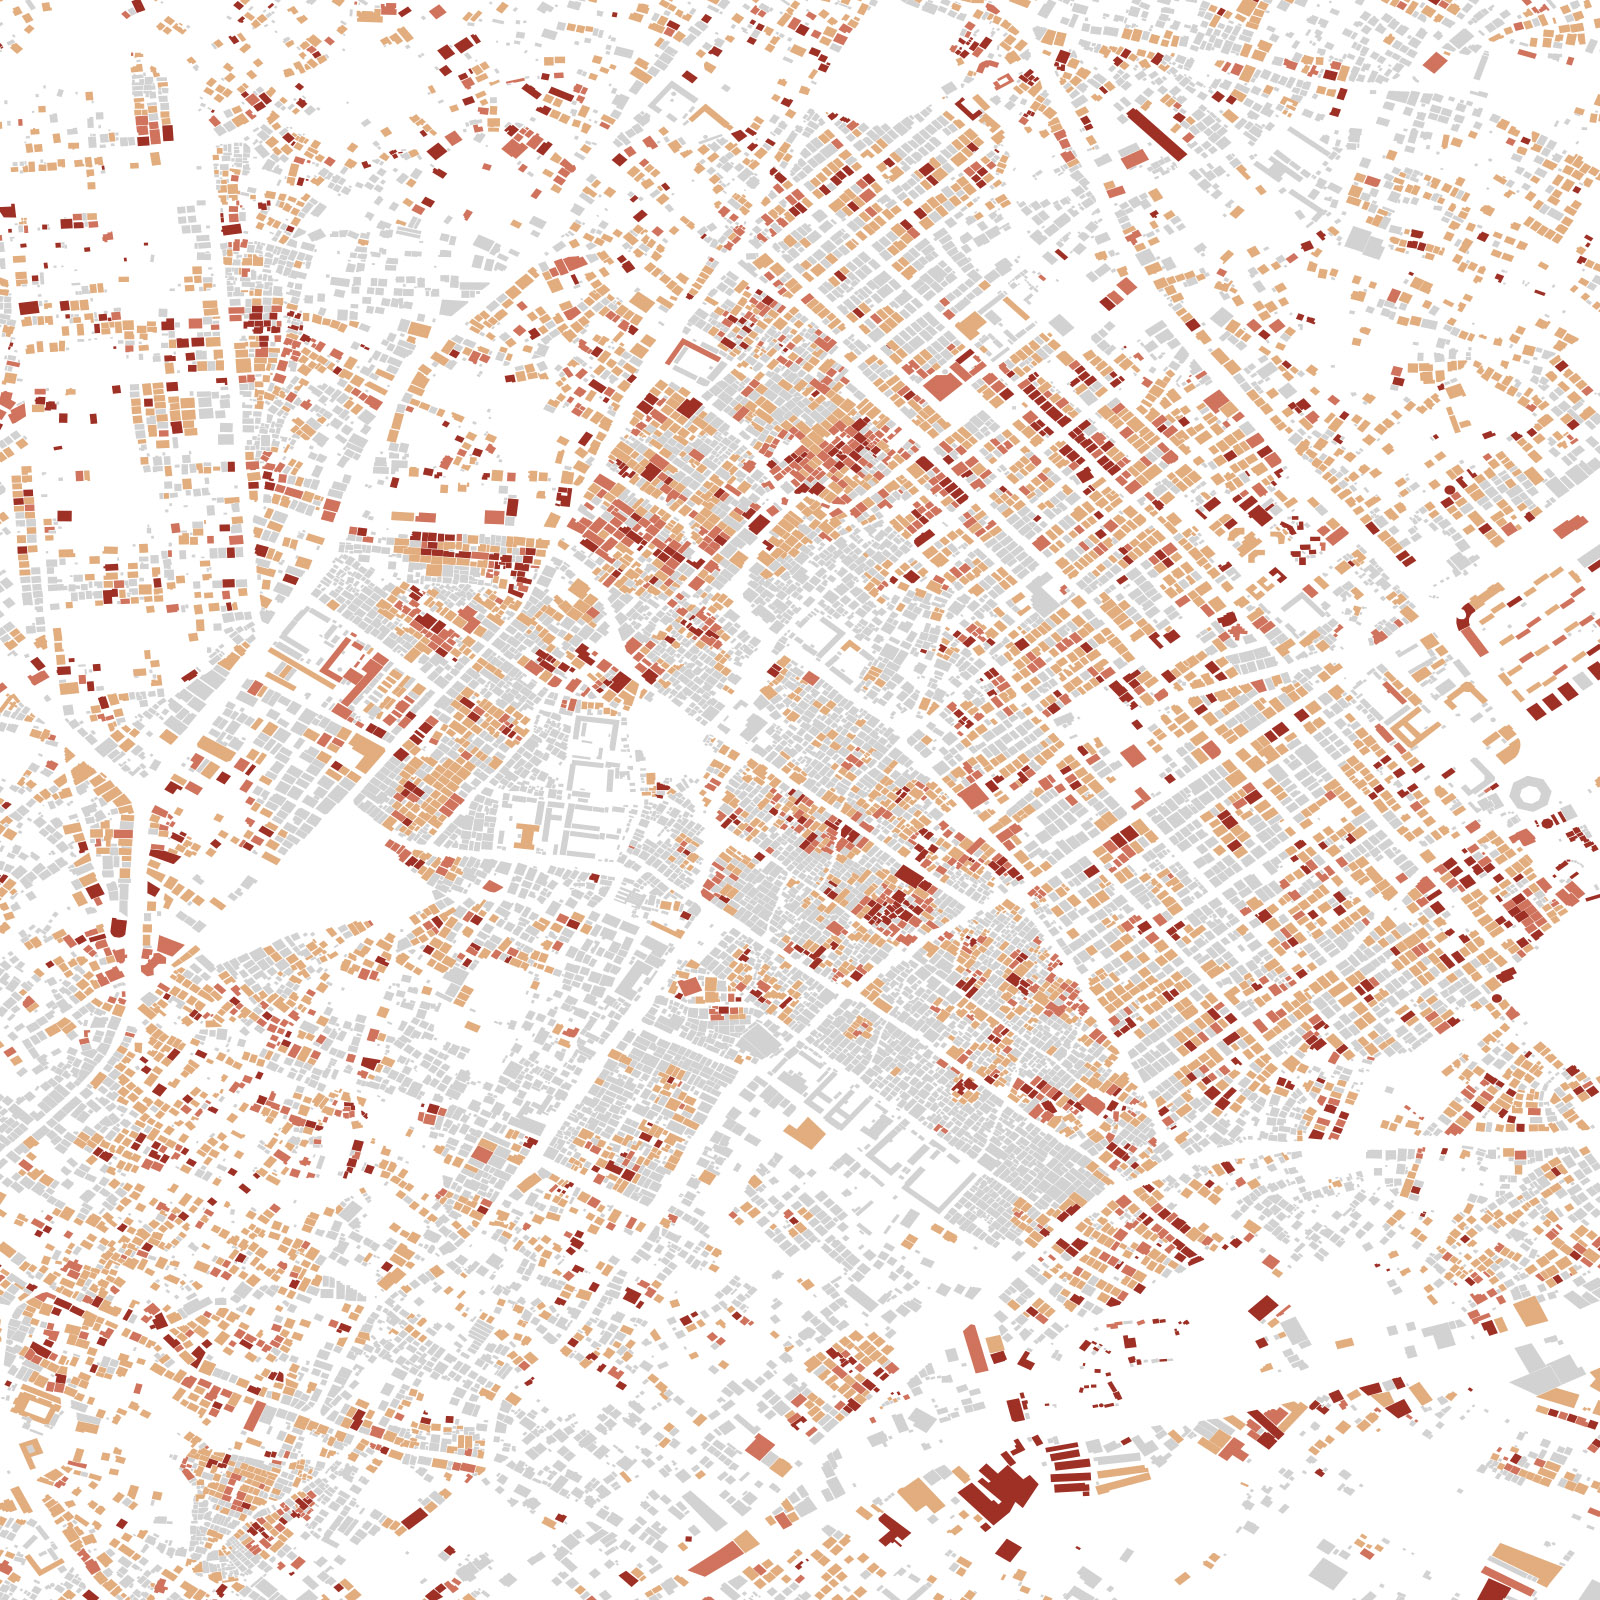
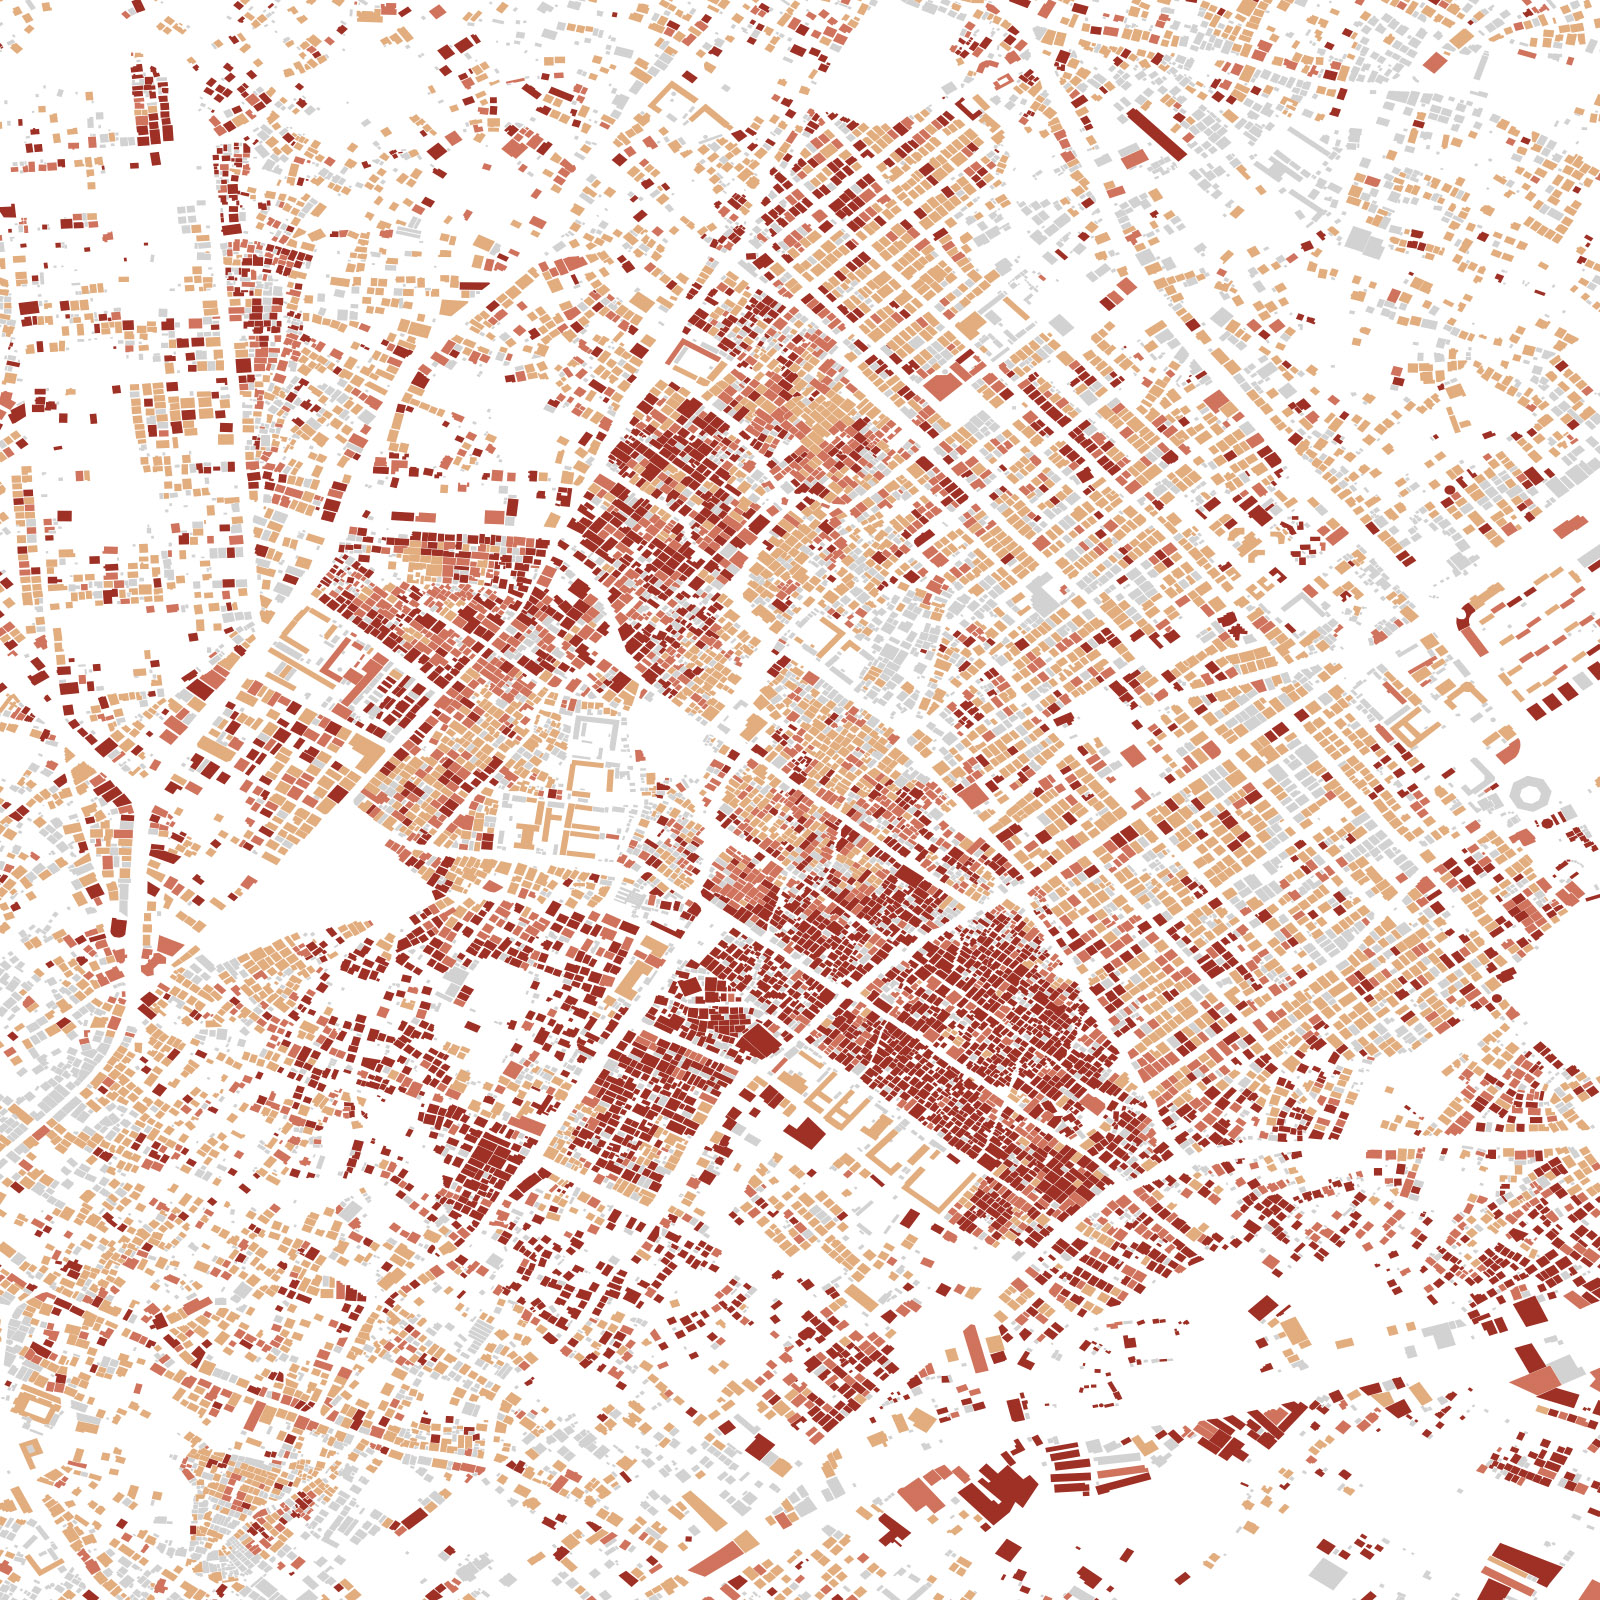
UNOSAT, the United Nations Satellite Observing Programme, provides point data on observed damage in the Gaza Strip. The next step was to match this point data with the building geometries from the previously obtained footprints. All data processing was done using PostGIS on a local PostgreSQL server instance. As UNOSAT regularly updates the data, it is possible to track changes over time. For example, the following series of visualisations shows how the destruction in the Jabalia neighbourhood in northern Gaza unfolded from mid-October 2023 to early December 2024.
No damage observed Moderate damage Severe damage Destroyed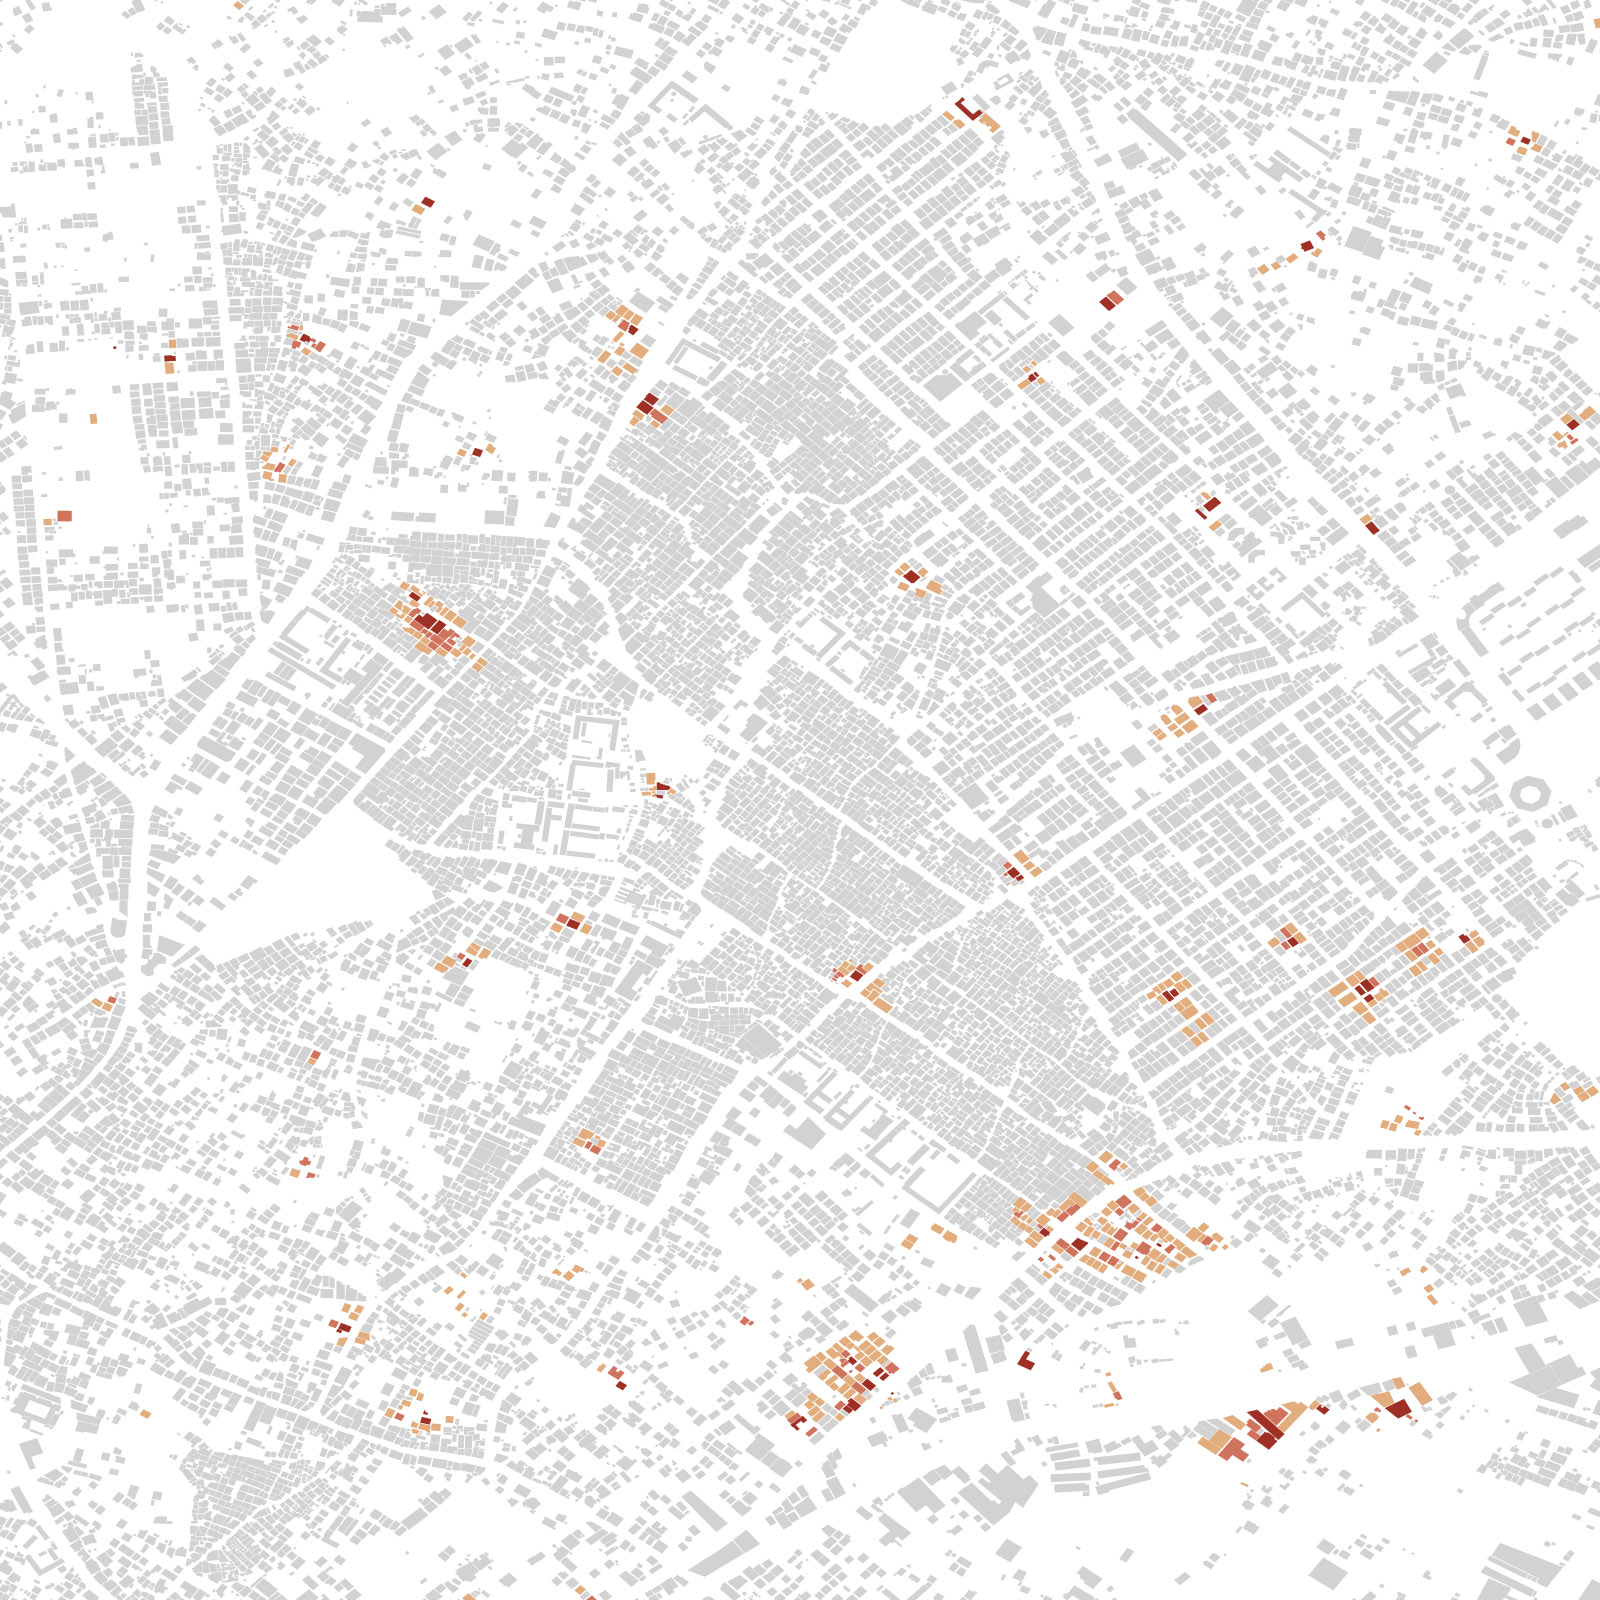
…and and revealing larger patterns
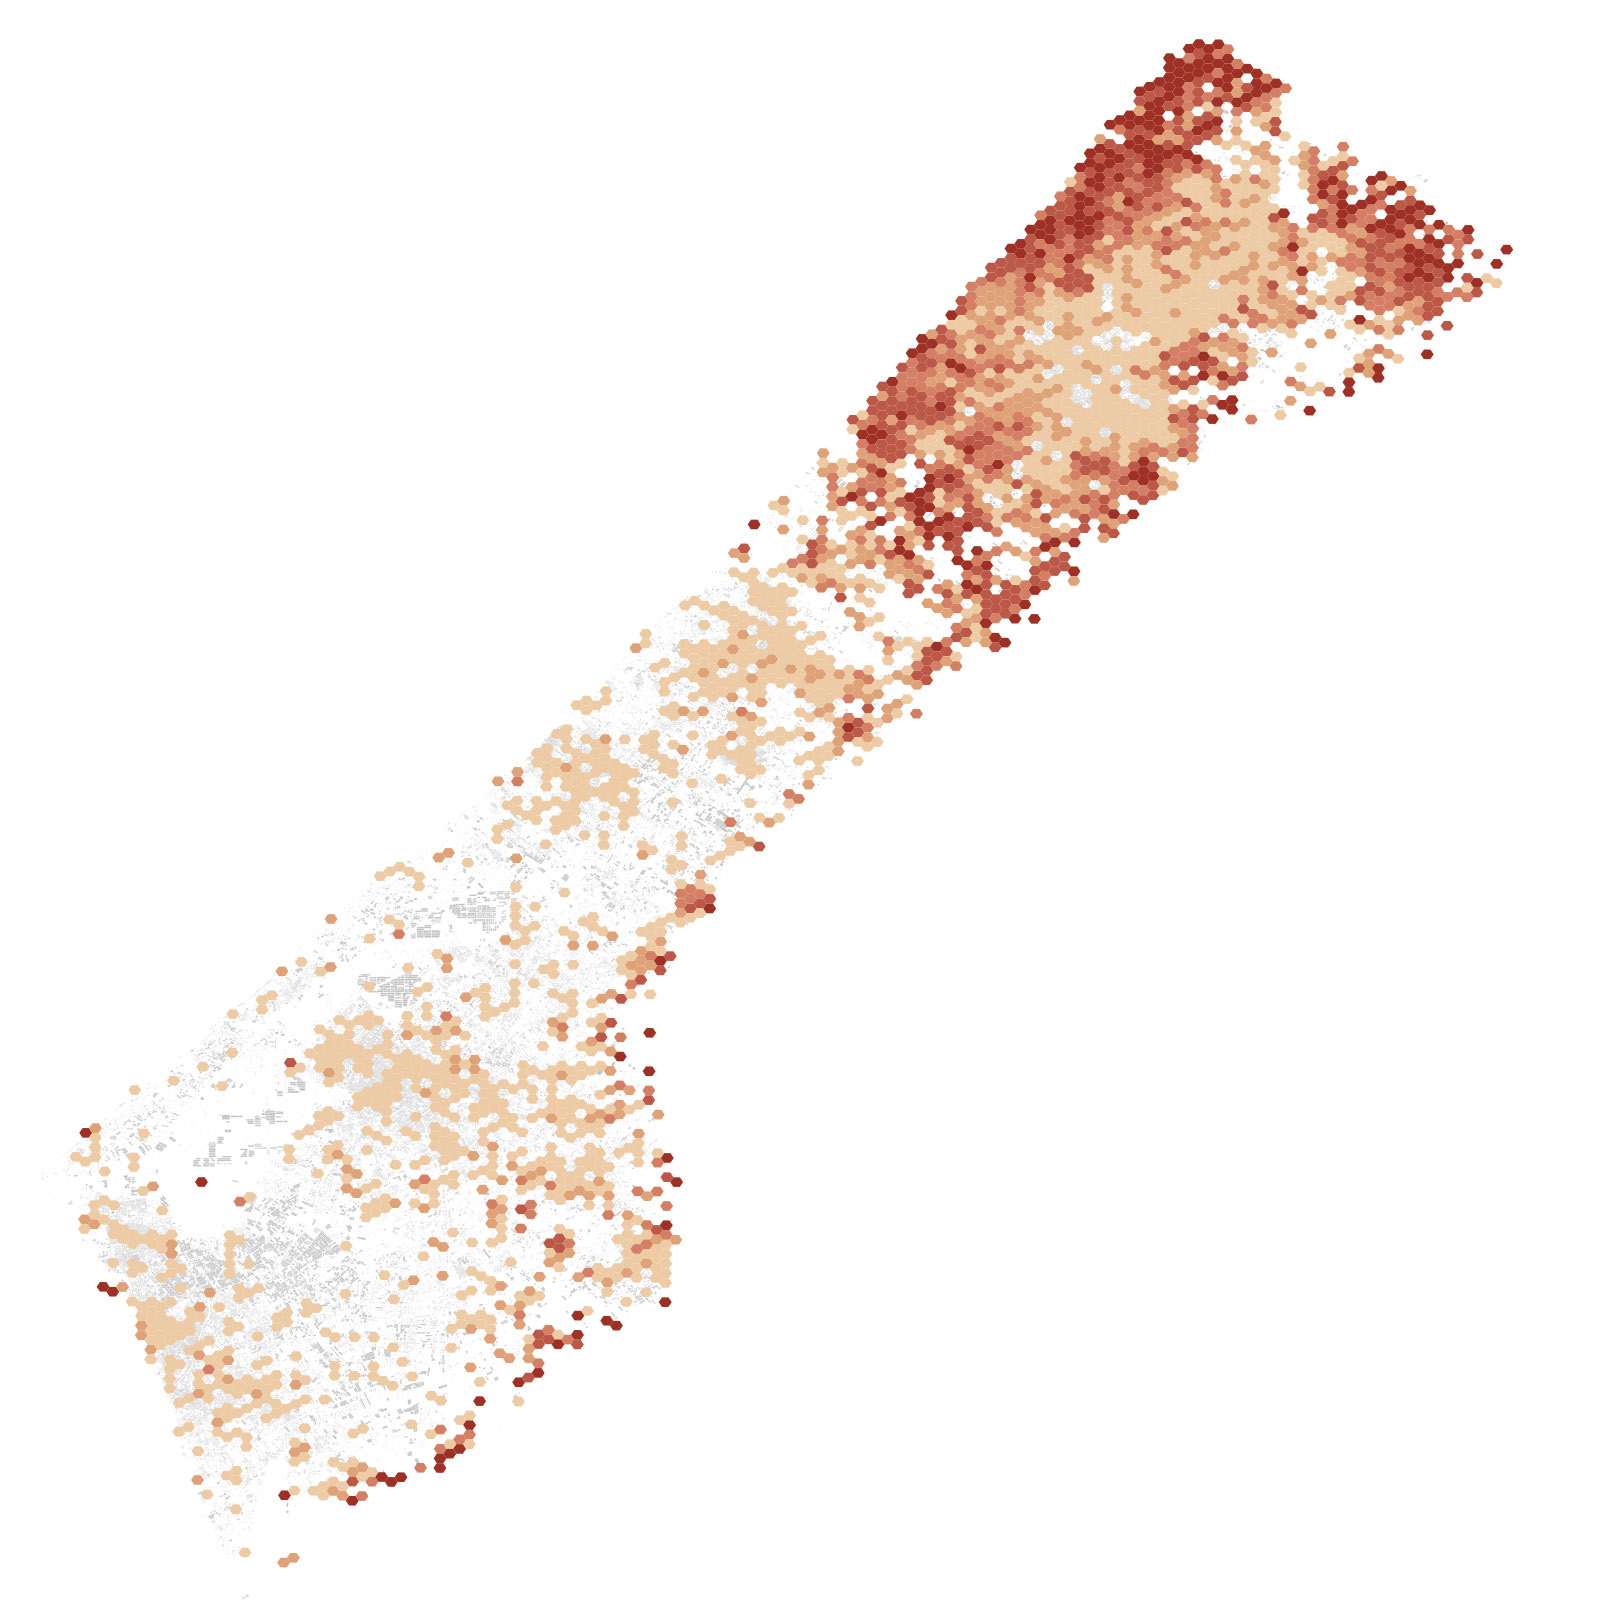
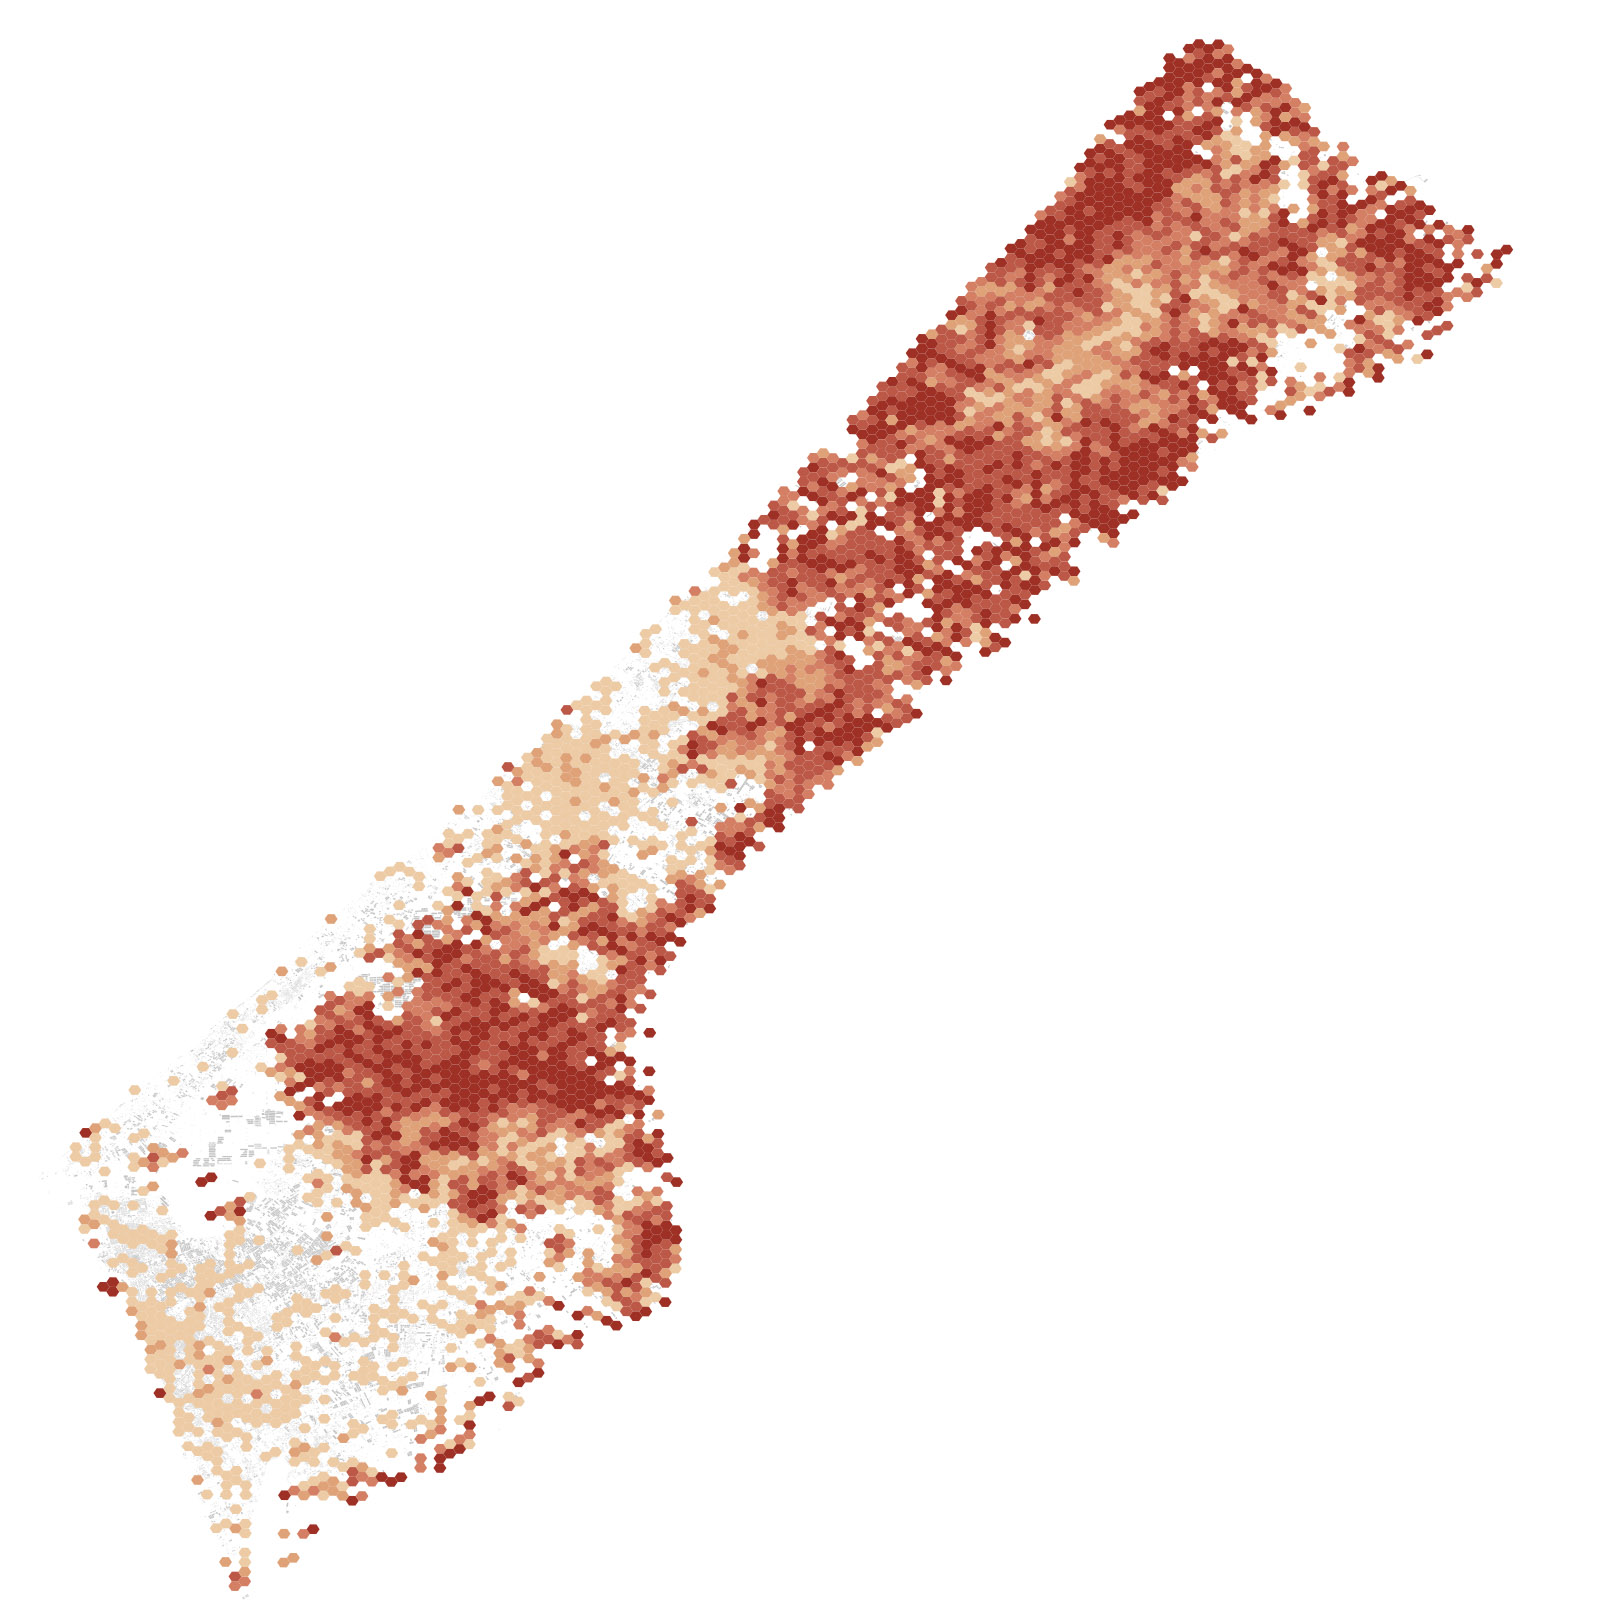
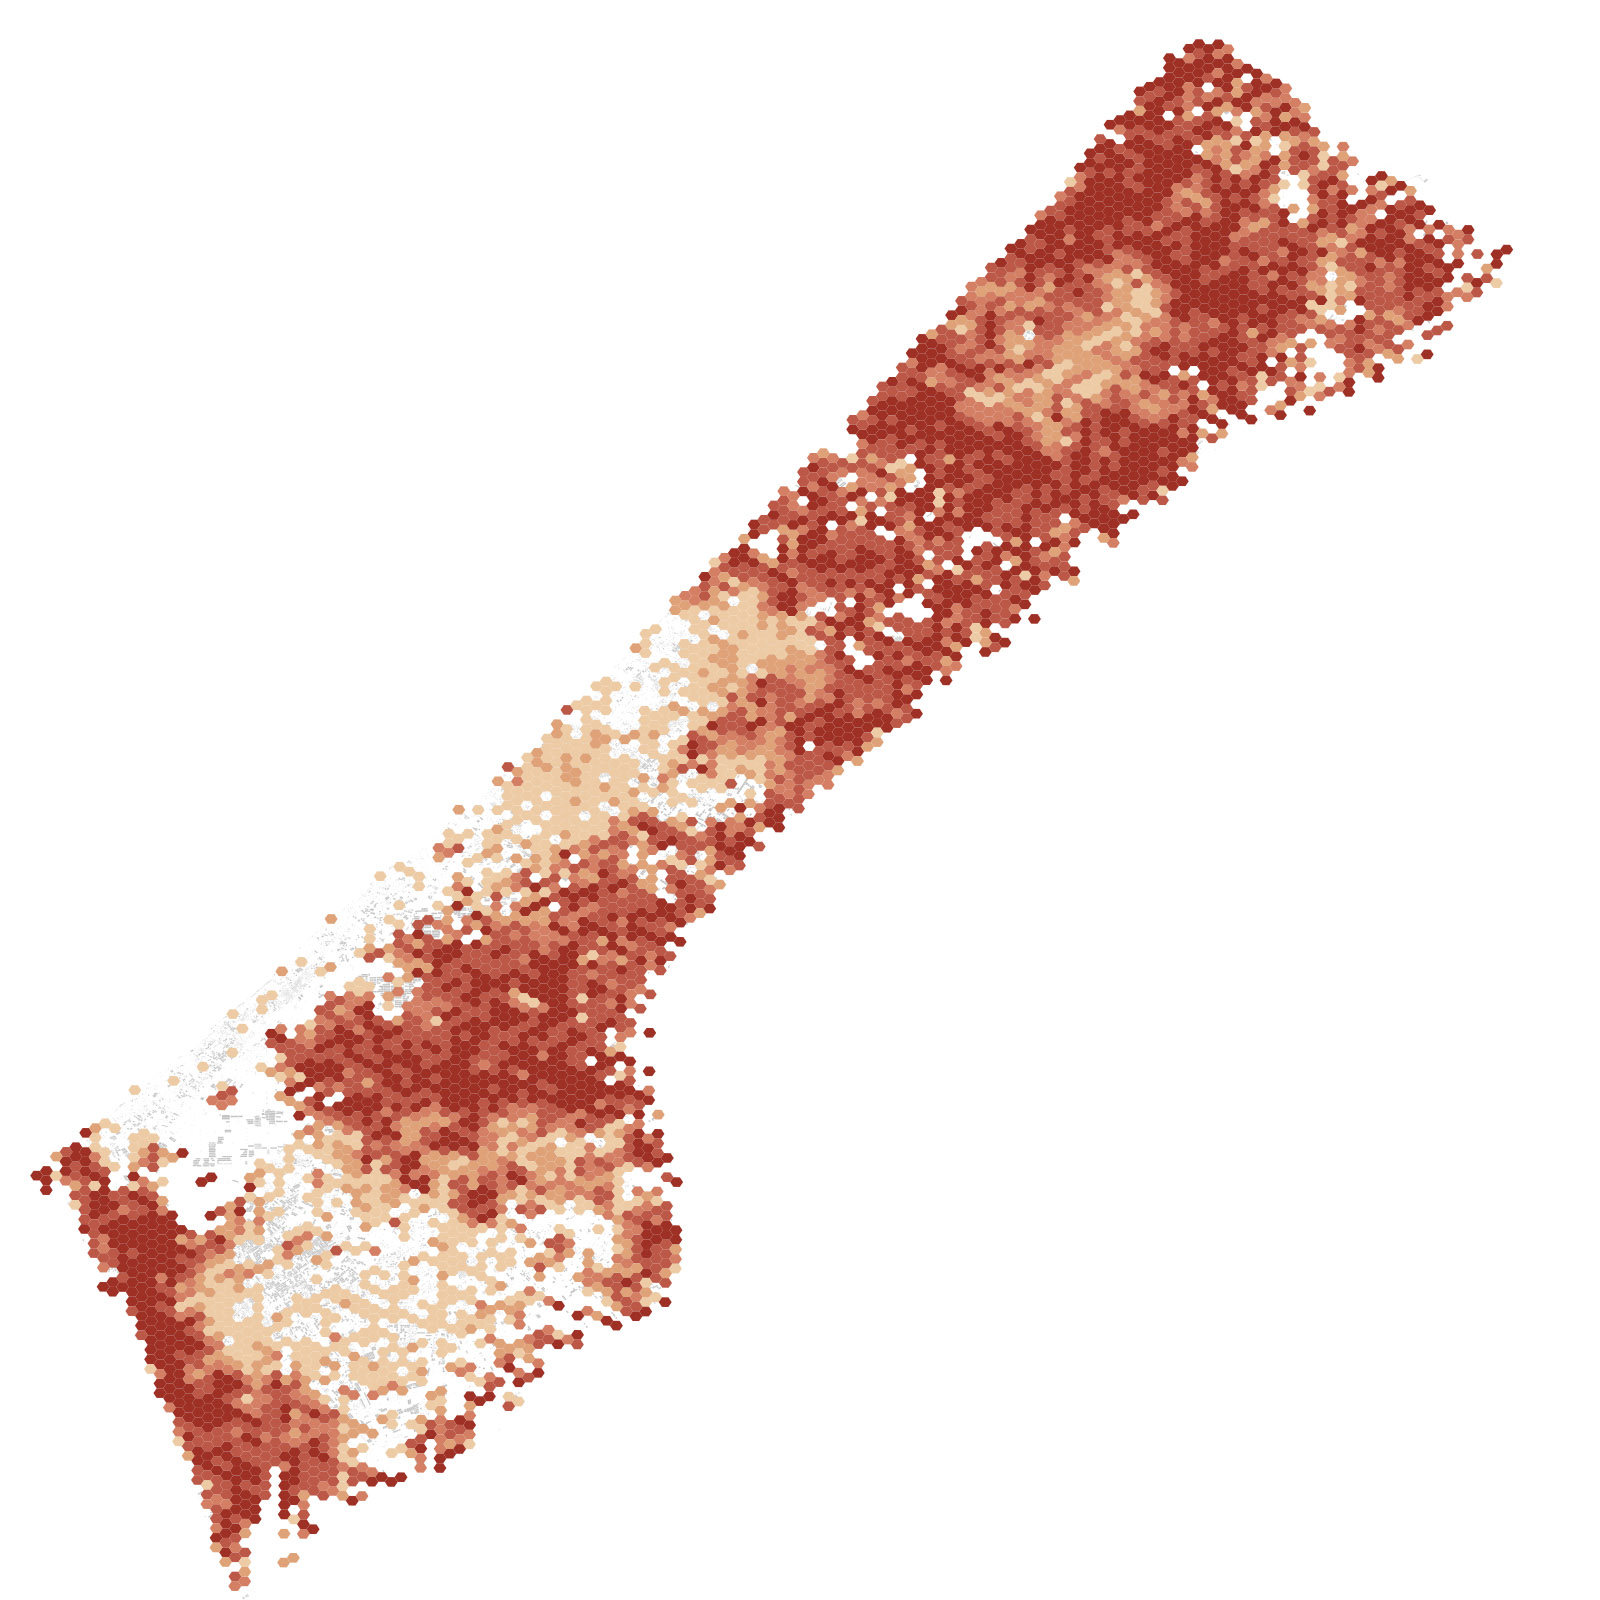
In order to show larger patterns across the Gaza Strip, I calculated aggregated statistics. To produce the following graphs, I clustered the buildings into a grid of equal-sized cells. I then calculated the damaged proportion of the total built-up area within each grid cell. As a result, the series shows how the Israeli offensives evolved from north to south during more than a year of war between mid-October 2023 and early December 2024.
Destroyed area as a share of total built-up area >0% 20 40 60 80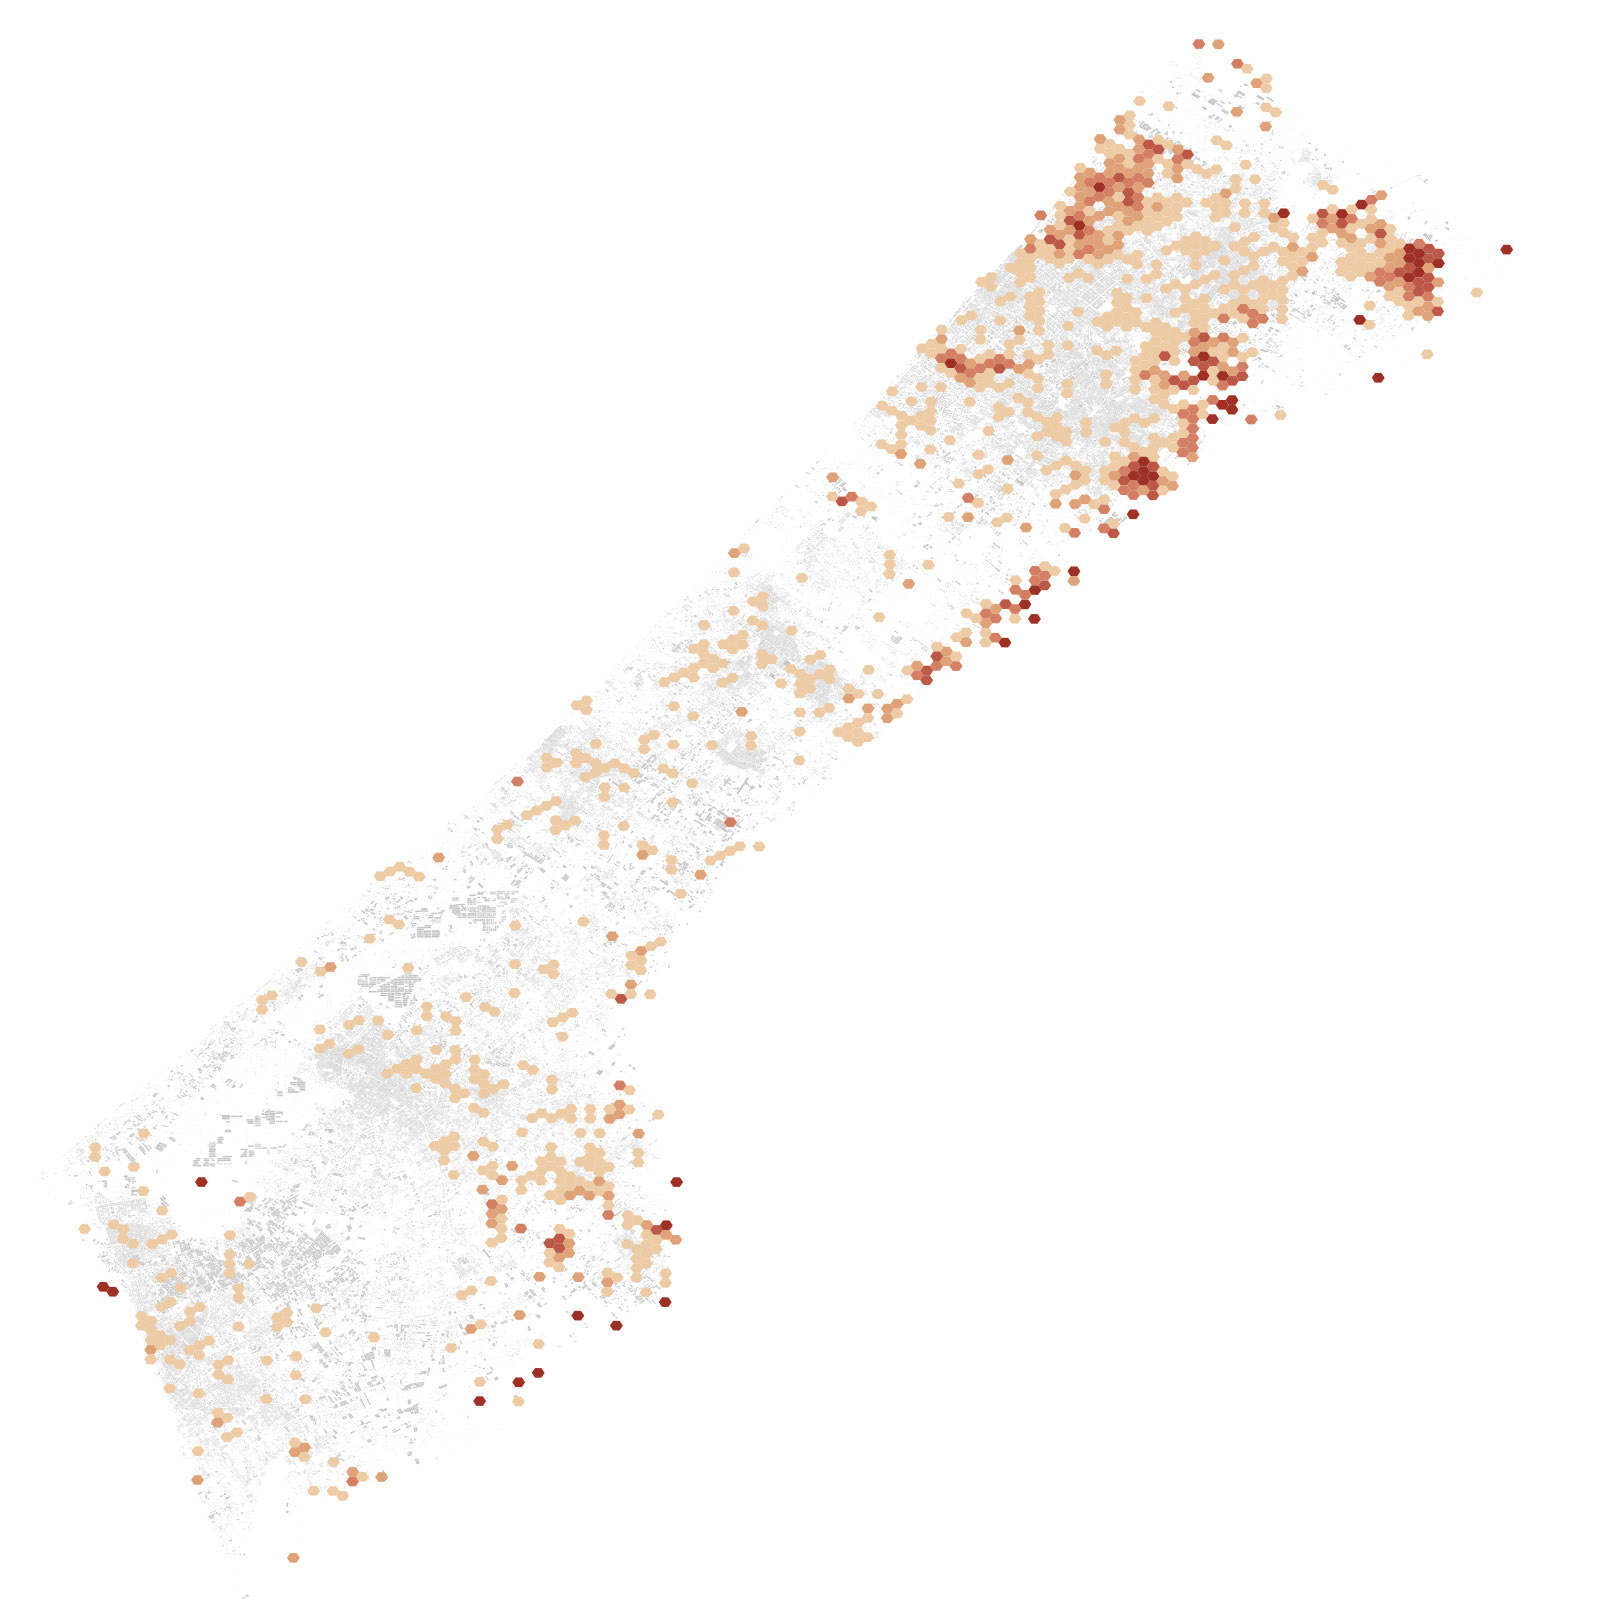
The resulting dataset allowed us also to compute damage statistics for different governorates within the Gaza Strip.
See it live
- »Apocalypse Gaza« – published at »Der Spiegel« on October 7th, 2024 (paywalled)